The Month In Markets - October 2023
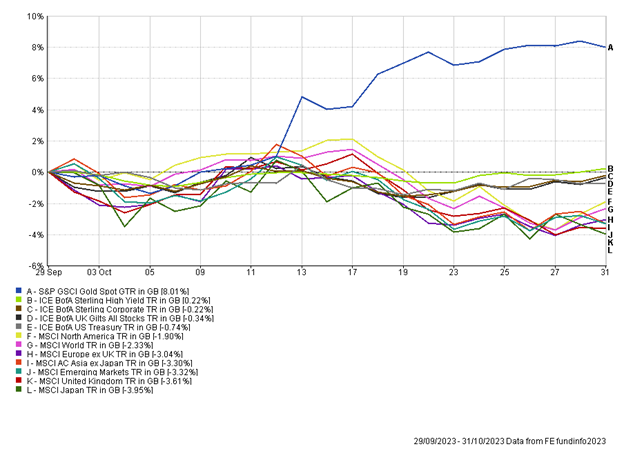
October was a challenging month; however, gold bucked this trend, producing strong returns. The precious metal is held across portfolios at Raymond James, Barbican. We believe it is important to broaden the investment toolkit, from simply equities and bonds, to include other asset classes such as commodities and infrastructure.

Gold is often thought of as a safe-haven asset, while also having an element of inflation protection, given it is a real, or physical, asset. It’s perhaps because of these characteristics why the gold price pushed above $2,000 oz during the month of October. Geo-political risks escalated significantly in October following the events in the Middle East. The heightened concerns and risks to the global economy will likely have pushed investors to assets such as gold. However, government bonds, often an asset class that performs well in crisis, failed to respond. The attacks by Hamas led to concerns around the supply of oil from key producers such as Iran. The oil price rallied, pushing close to $100 a barrel. Higher oil prices are inflationary, through cost-push inflation and as such inflation expectations nudged higher during the month, likely explaining why government bonds were out of favour, and gold was the safe-haven asset of choice.
Equities fell during the month. The chart does not tell the full story, with the small and mid-cap parts of the market coming under pressure. Within the UK the mid-cap index fell by over 7%, while the large-cap UK index fell by circa 4%. This trend of large cap companies outperforming was consistent across developed markets. There will have been a range of factors driving this; mid-cap stocks are often seen to be more interest rate sensitive – higher oil and higher rate expectations were apparent over October. A flight to safety in equities often results in investors moving up the market cap spectrum to larger companies, which can be perceived to be more reliable; the events in the Middle East could have triggered such a move.
US inflation data showed that inflation remained steady at 3.7%. While this is a dramatically improved picture from 12 months ago, inflation has nudged up from the 3% low in June. The main reason for this is the rise in oil prices over the summer months – this feeds straight into gasoline prices in the US, pushing inflation up. We’ve also seen the shelter (rent) component of inflation remain sticky, although there is an expectation this will moderate as we head into 2024. UK inflation also remained steady, at 6.7%. Again, the inflation picture has improved over 2023, however, the headline figure is significantly above target. We should see a drop in the figure as the latest energy price cap came into effect on 1st October 2023, with the average household bill expected to decline by 7%.
While certain leading indicators slowed around the globe, suggesting that higher interest rates are beginning to bite, Q3 GDP data from the US showed the economy grew at an annualised pace of 4.9%. Excluding the COVID-19 rebound this was the highest US GDP release since 2014. The consumer remains strong in the US, supported by excess savings built up during months of lockdown. US government spending is running at elevated levels, often seen during periods of recession, which is driving growth. This is unlikely to be sustainable over the long-term, given the current budget deficit.
Following previous pauses by key central banks it is possible we are now at, or close to peak interest rates for this point in the cycle, with interest rate cuts likely to start in 2024. We have taken the opportunity to step out of money market funds, which were held as a cash proxy, and add more to short-dated government bonds, effectively locking in attractive nominal yields and adding a more defensive tilt.
Andy Triggs
Head of Investments, Raymond James, Barbican
Risk warning: With investing, your capital is at risk. Opinions constitute our judgement as of this date and are subject to change without warning. Past performance is not a reliable indicator of future results. This article is intended for informational purposes only and no action should be taken or refrained from being taken as a consequence without consulting a suitably qualified and regulated person.
Appendix
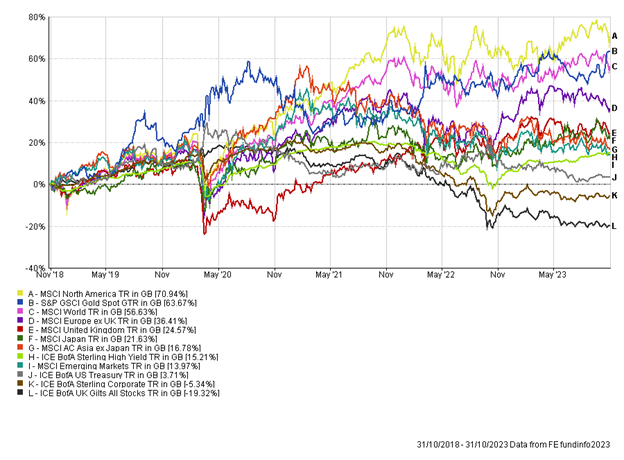
5-year performance chart

